data owner
You might have a few Excel spreadsheets or the whole data warehouse. It doesn’t matter. If you want to create a powerful data visualization, I can help you!
—
 Designing the whole reporting solution
It might be for the app you are working on, external usage, or something you want to use internally.
—
Building ad hoc dashboards
I’m your person if you need someone to deliver an effective dashboard in Tableau quickly.
—
Let’s make sense of your data together! Want to know more about the collaboration? Check what to expect when working together.
—
—
Inspirations for you
![]() Sales Summary Executive Dashboard
Sales Summary Executive Dashboard
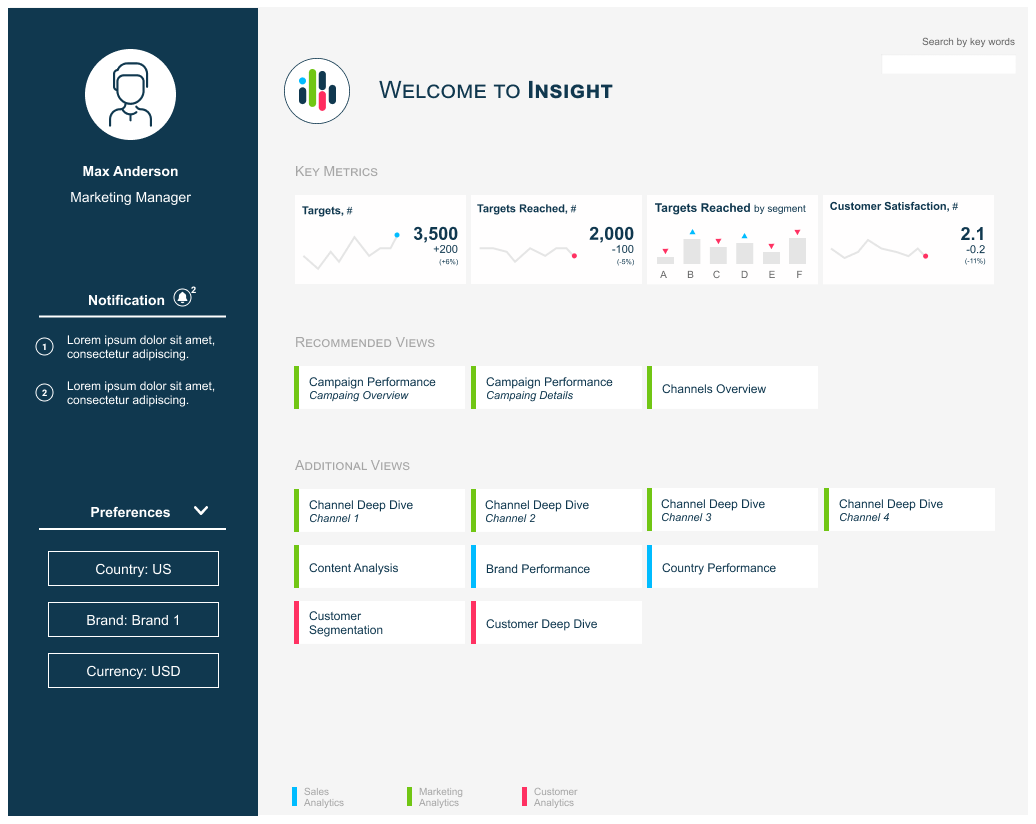
![]() Executive Overview
Executive Overview
![]() Marketing Performance Dashboard
Marketing Performance Dashboard
non-profit organization
Working in the non-profit sector comes with special needs. Even though you are dealing with a small budget and limited resources, you want to make an impact with your data! I have an offer tailored specifically for you and your team.
—
Perfect if you want to make an impact on your own and looking for a little push in the right direction.
—
I can build a solution for you whether you already know what you need or not. Book a first consultation and work together for a better cause!
—
Let’s make sense of your data together! Want to know more about the collaboration? Check what to expect when working together.
—
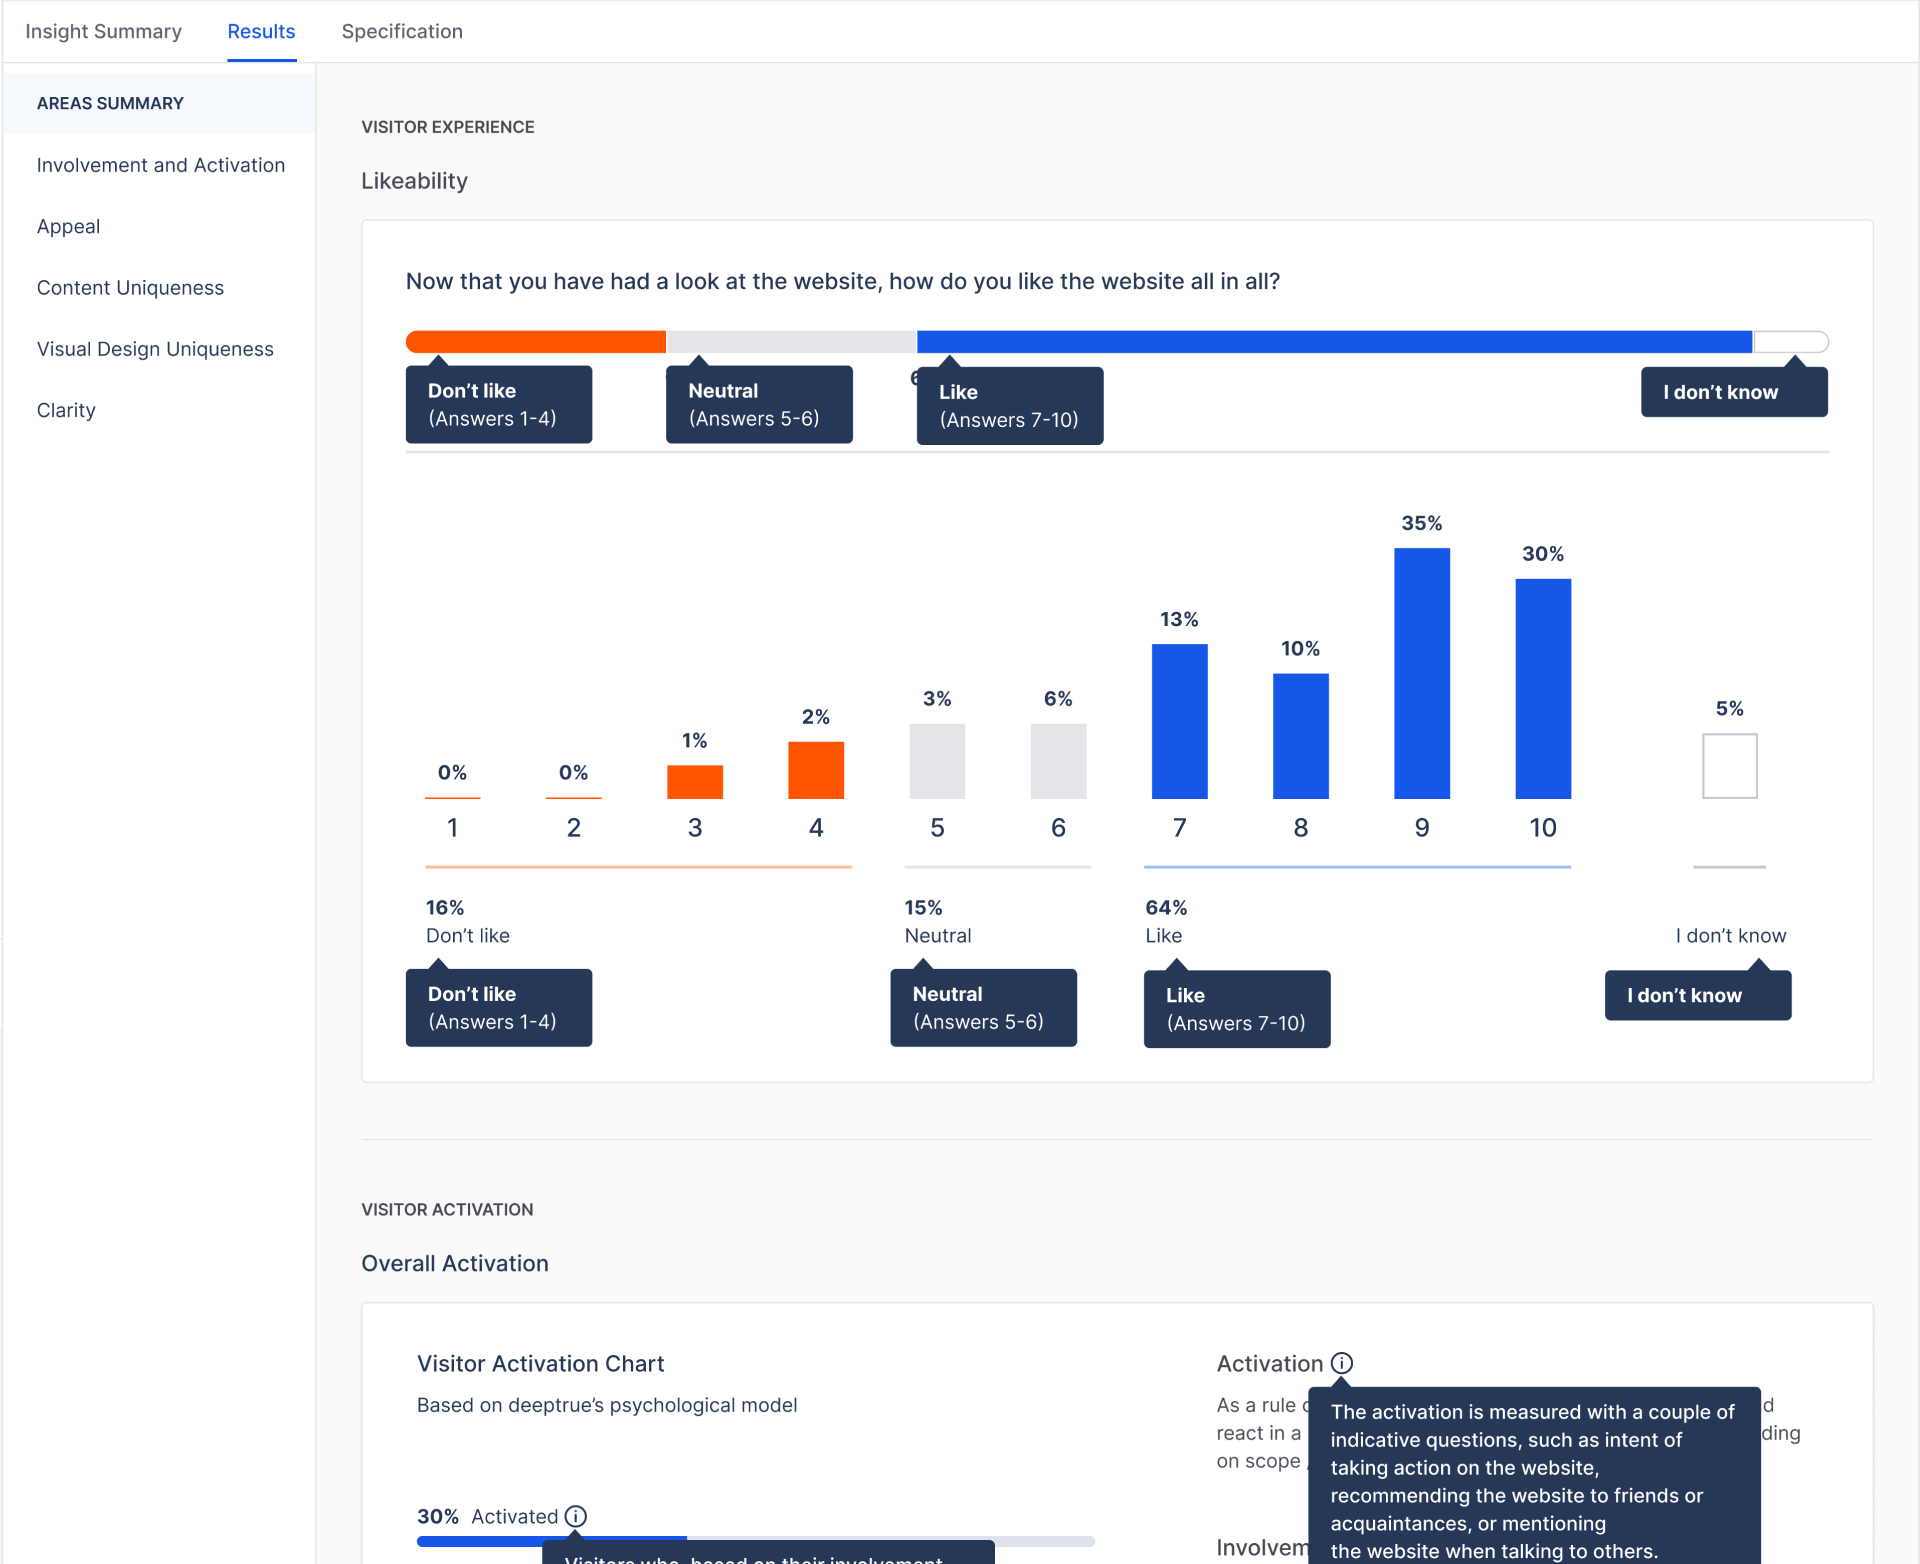
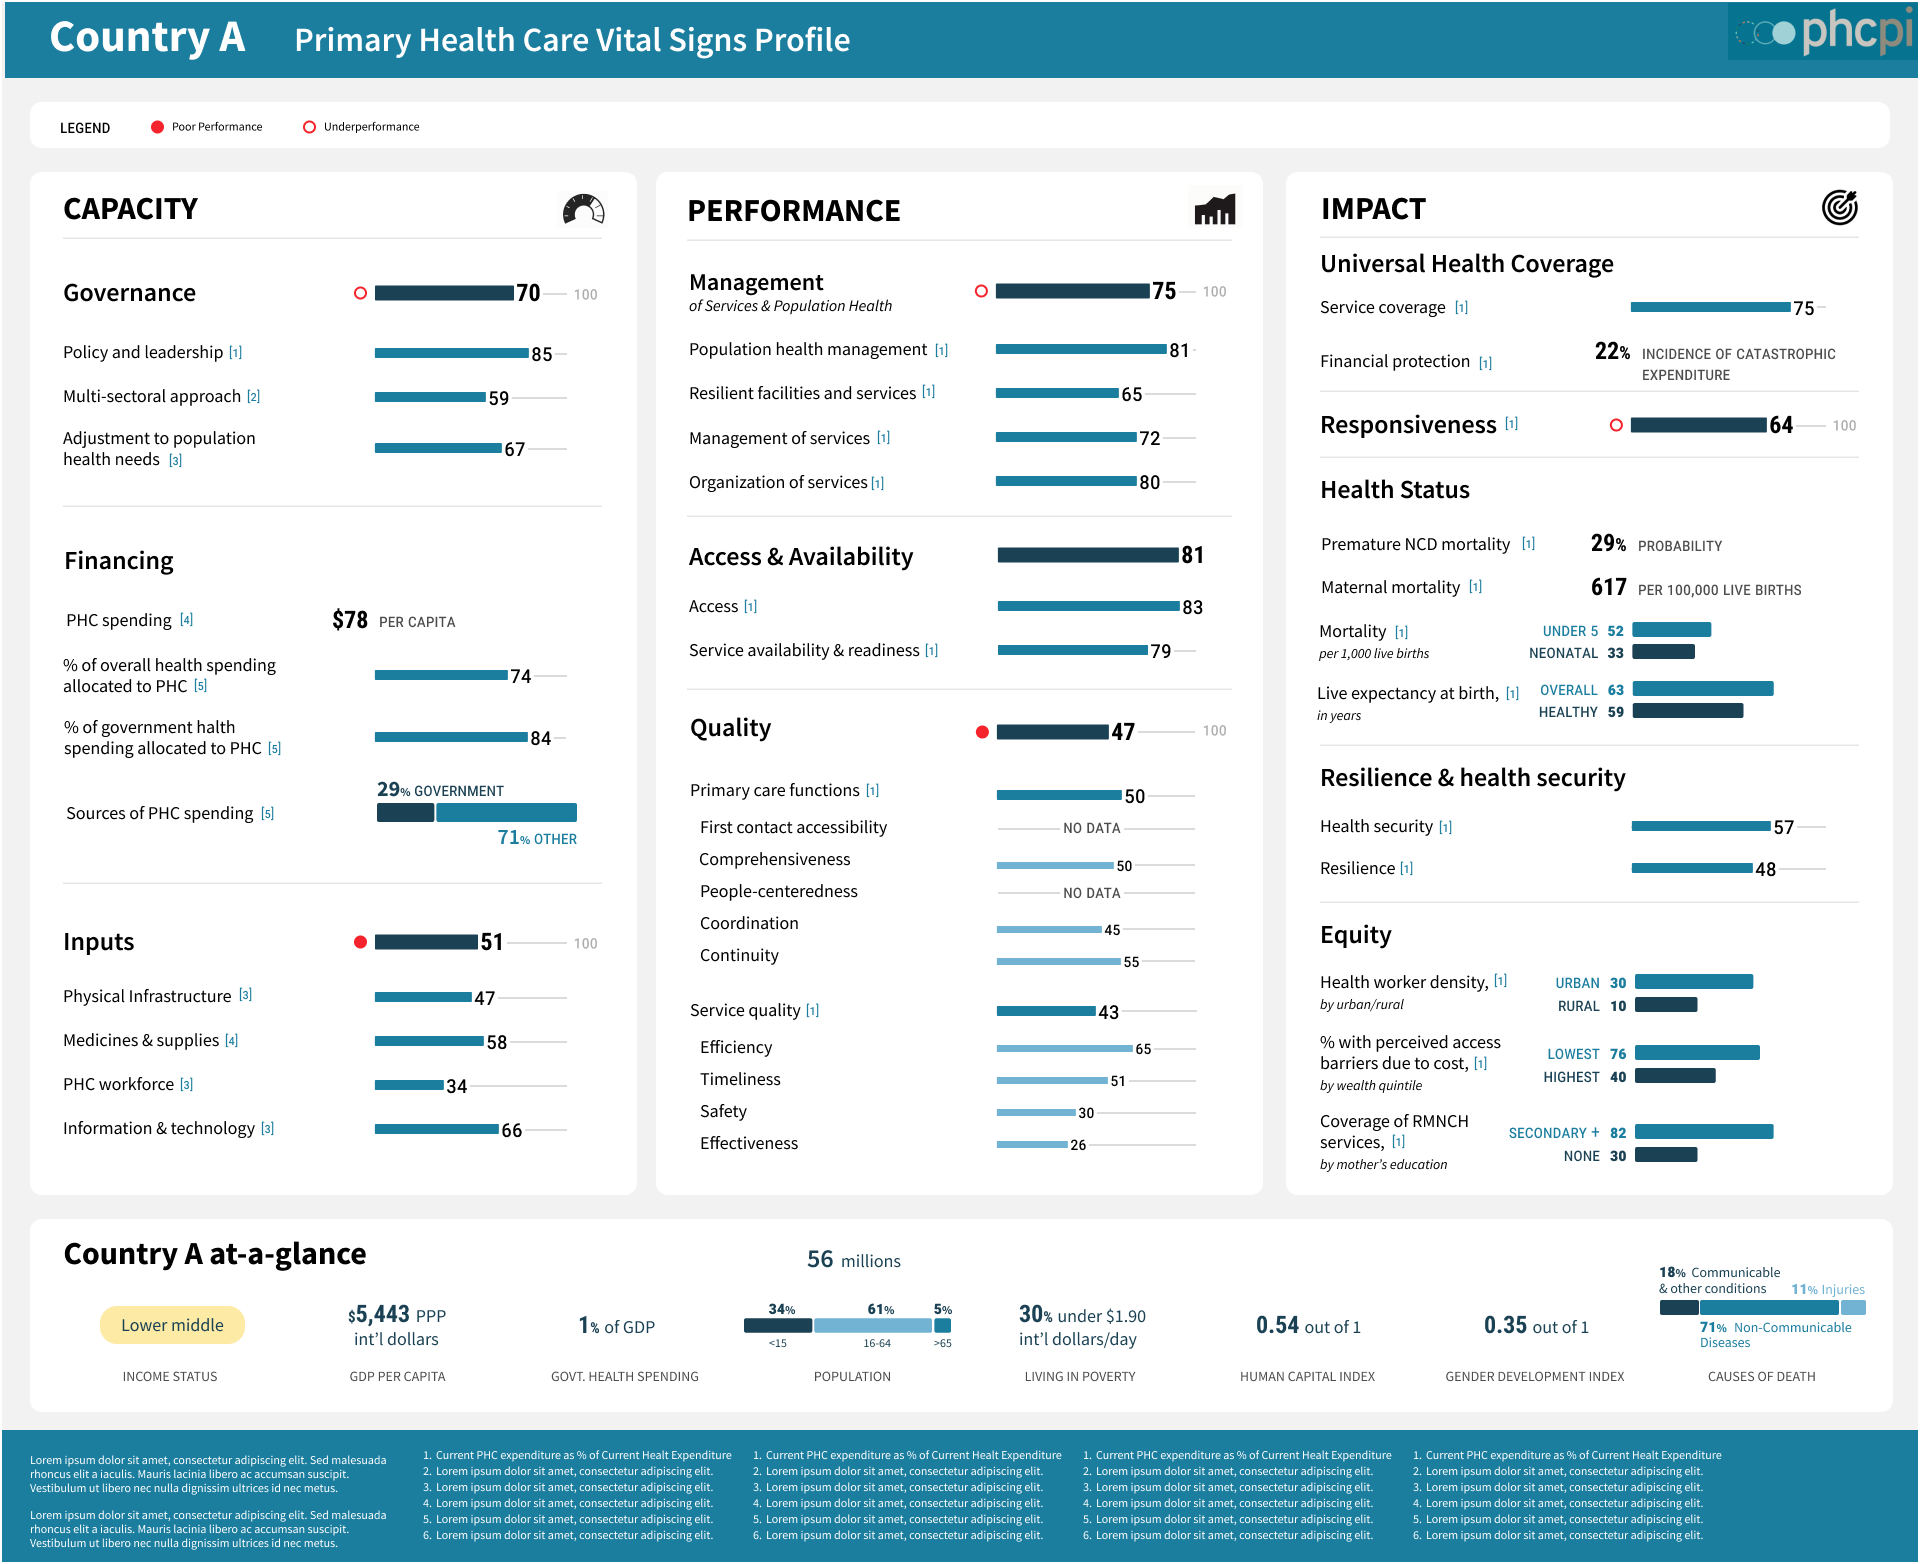
 Redesign of PHC’s Dashboard
Change in Women’s Empowerments
Stories of Women from Madagascar
How the Pandemic Shaped the World
Redesign of PHC’s Dashboard
Change in Women’s Empowerments
Stories of Women from Madagascar
How the Pandemic Shaped the World
Dedicated Tableau course for your team
Perfect if you want to make an impact on your own and looking for a little push in the right direction.
—
Special price for consultancy
I can build a solution for you whether you already know what you need or not. Book a first consultation and work together for a better cause!
—
Let’s make sense of your data together! Want to know more about the collaboration? Check what to expect when working together.
—
—
Inspirations for you
Tableau user
Stay tuned! I’m working on a special course for you!
someone looking for an inspiration
Every week I prepare a makeover of the chart. No matter what your experience is, you should find something for yourself in the Incremental Improvements series!
Dataviz essential resources: where to start your journey?
Poor chart choices that I made so you can avoid them
10 design principles to take your dashboards to the next level
The Function of Color in Data Viz: A Simple (but Complete) Guide
9 interactive resumes in Tableau that you can reuse right now
Inspirations for you


Weronika
Gawarska-Tywonek
DATA VISUALIZATION DESIGNER & TRAINER
Weronika
Gawarska-Tywonek
DATA VISUALIZATION DESIGNER & TRAINER